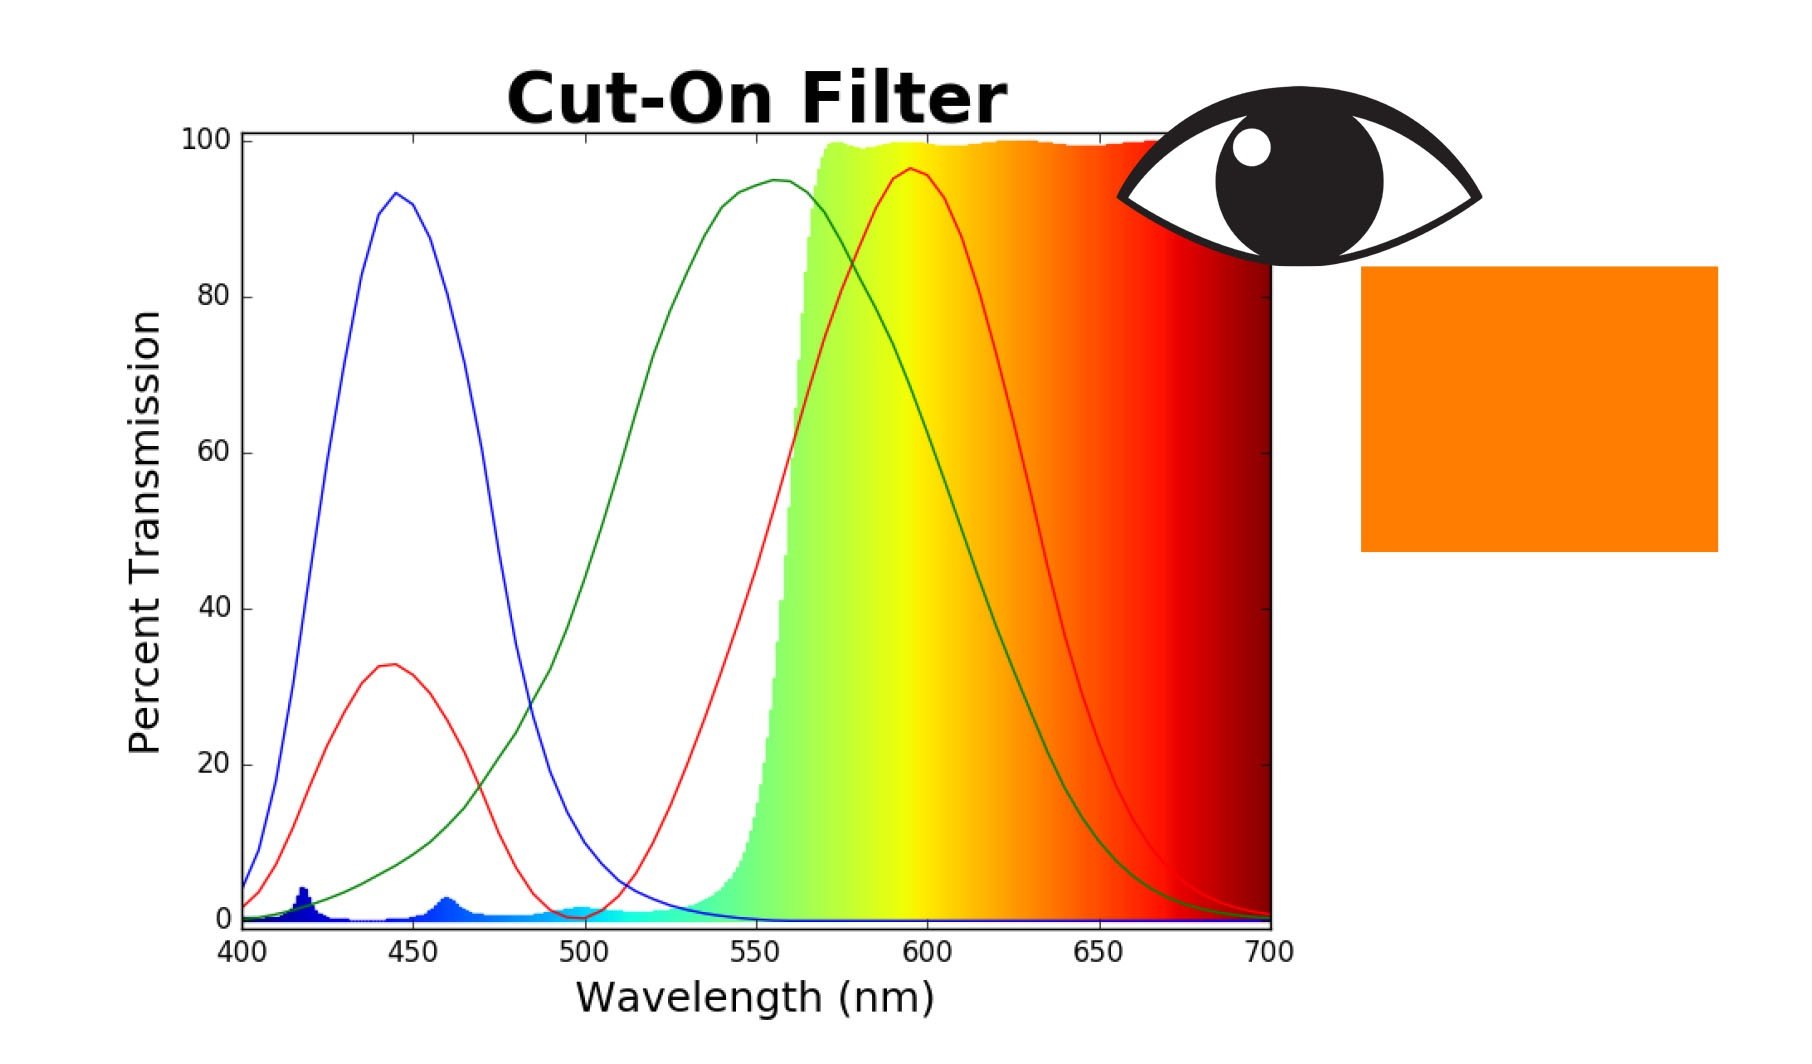
The performance of a cut-on optical filter is typically presented using the plot of the percentage transmission at each specified wavelength. The figure below demonstrates the combination of light that would be transmitted through a cut-on filter with the stopband and passband in the visible range. The red, green and blue curves are color matching functions designed to quantify the way the human eye perceives color. When the transmitted spectrum is combined with color matching functions, we can see that the light transmitted through the filter will appear to be orange colored.
Color Matching through Optical Coating: Visualizing an Example Cut-on Filter
Posted by
The VisiMax Team on Aug 10, 2017 9:14:00 AM
Topics: Optical Filters, Color Matching


