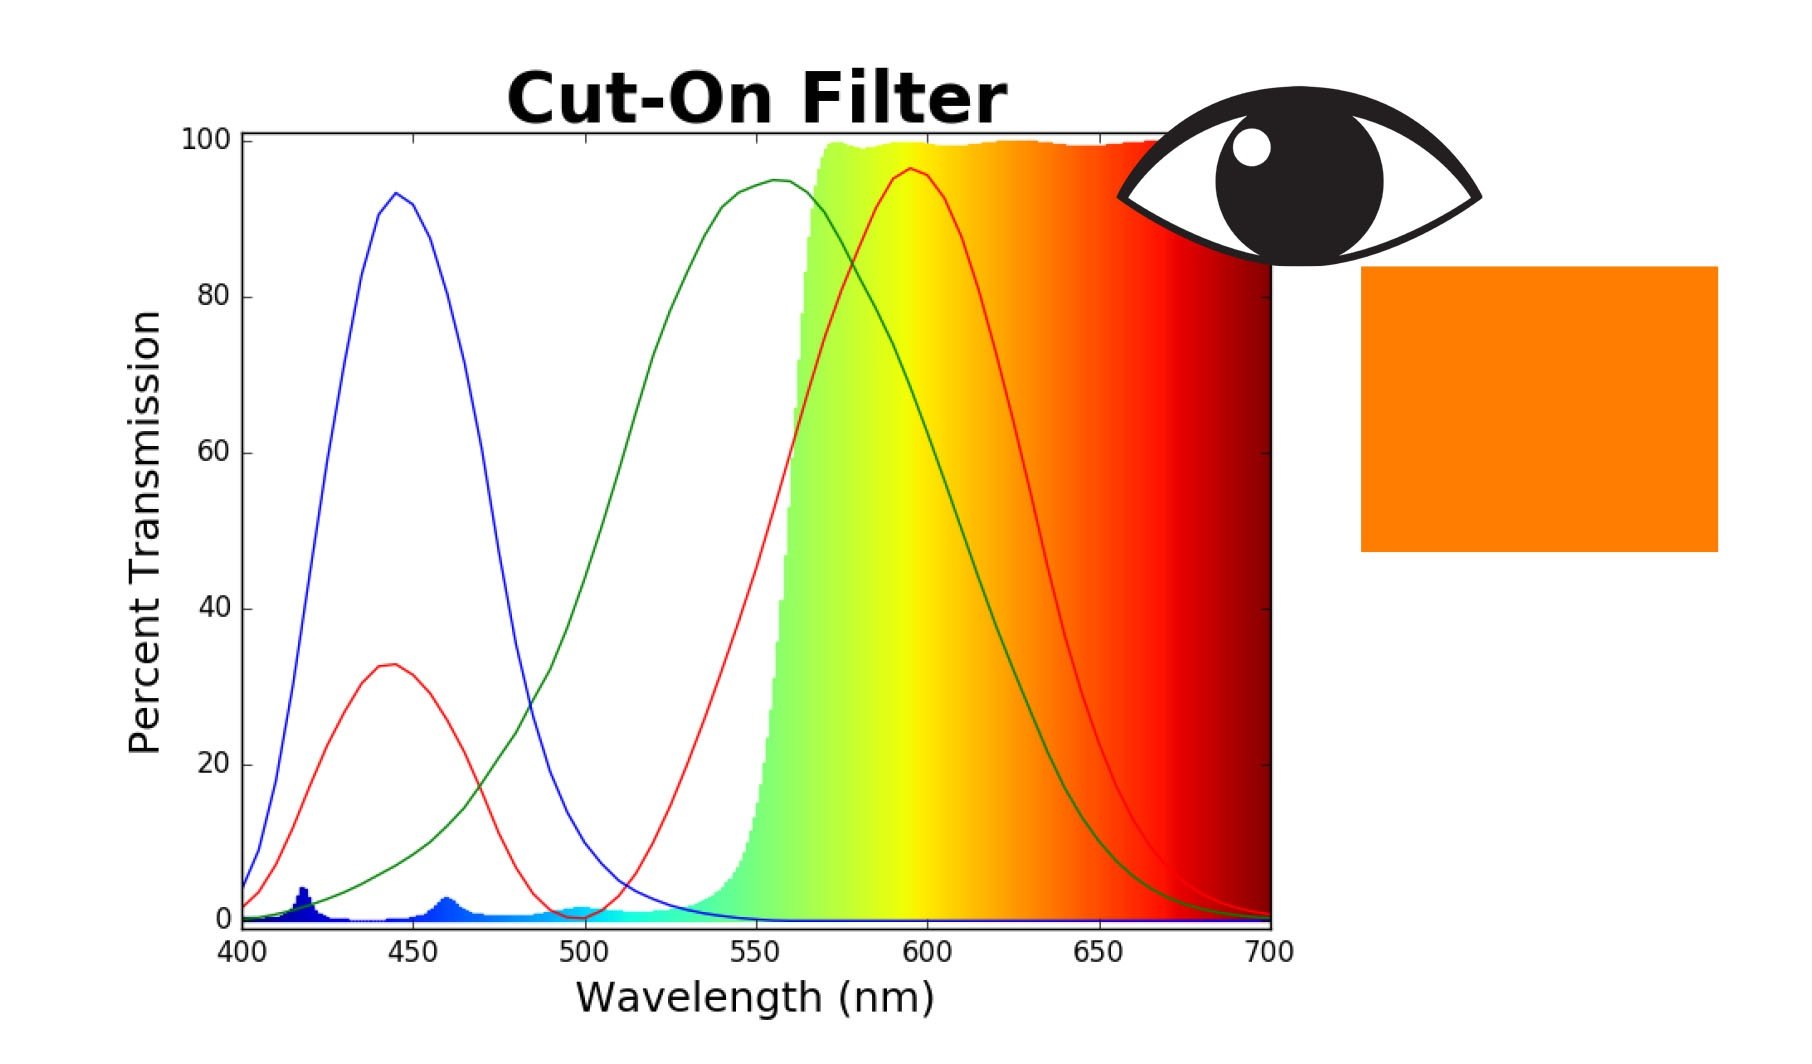
The performance of a cut-on optical filter is typically presented using the plot of the percentage transmission at each specified wavelength. The figure below demonstrates the combination of light that would be transmitted through a cut-on filter with the stopband and passband in the visible range. The red, green and blue curves are color matching functions designed to quantify the way the human eye perceives color. When the transmitted spectrum is combined with color matching functions, we can see that the light transmitted through the filter will appear to be orange colored.

When product specifications require a specific color, simply specifying the passband and stopband is not the best way to ensure repeatability of the desired color. Cut-on filters can control the light coming from the light source, but to control how the human eye will perceive the filtered light source, it is important to take into account the color matching functions of the human eye. Color depends on the light source used and how sensitive the human eye is to different parts of the visible spectrum. For this reason, a color target in color space and tolerance should be specified to achieve repeatable performance of colors.


